A couple of years have passed since we started quantifying the bottom-line costs of offshoring. I must say that doing it right is a very hard work. I am proud to share the next data point – a Swedish company (anonymously referred to as SwedCo) that develops complex software intensive systems and has on-boarded Indian developers on a 15+ years old legacy product. Our task was to obtain as objective performance and cost evidence as possible. In contrast to the DutchCo case, we approached the learning curve measurement differently. We have studied all customer-specific features completed by the Indian teams during their first two years of work, and compared them with a number of similar tasks completed by the mature teams from Europe and USA.
Measurements
First we measured performance in terms of the hours per complexity point. We used the real effort per task from the archives. We normalized it by a fictitious measure of complexity points, which represented as objective complexity of a task as possible, and were estimated by the architects involved in designing the features. Notably, during the estimation they did not consider who completed a task.
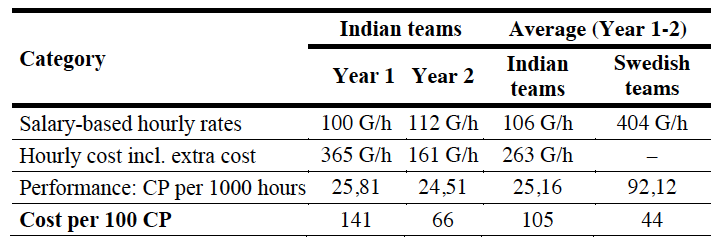
We have traced a number of cost drivers that were not present in the work of mature teams, such as the travel costs, knowledge transfer costs, costs of control, support costs, rescue costs (fire-fighting performed by the architects) etc. Some of these costs were unforeseen by SwedCo. Two types of costs were then calculated:
- Hourly costs as the salary-based hourly rates + the extra costs,
- Bottom-line costs per 100 complexity points as the hourly costs divided by the productivity.
Due to confidentiality we were unable to disclose the real costs, and all our costs are expressed in Galleons, a fictitious currency. On the bright side, we have been lucky to get access to performance data from the inception of the Indian teams and cover their first two years of work.
What did we find?
All cost drivers that we have identified could be directly or at least strongly attributed to three categories:
- the transfer of work or the onboarding process,
- working on a distance,
- immaturity of the offshore site.
When the of extra costs were added, the hourly costs have increased several times if comparing with the salary rates. The initial 4 time difference in the salary costs (100 galleons/h in India versus 400 galleons/h in Sweden) turned into a mere different of 35% in favor of the Indian teams on average after two years.
The performance gaps between the mature sites and the immature site led to an even higher difference. As a result, two years after on-boarding of the offshore teams, the bottom-line costs of the mature teams in high-cost locations continue to be 40% “cheaper” despite the big salary differences.

Guess what is the main factor?
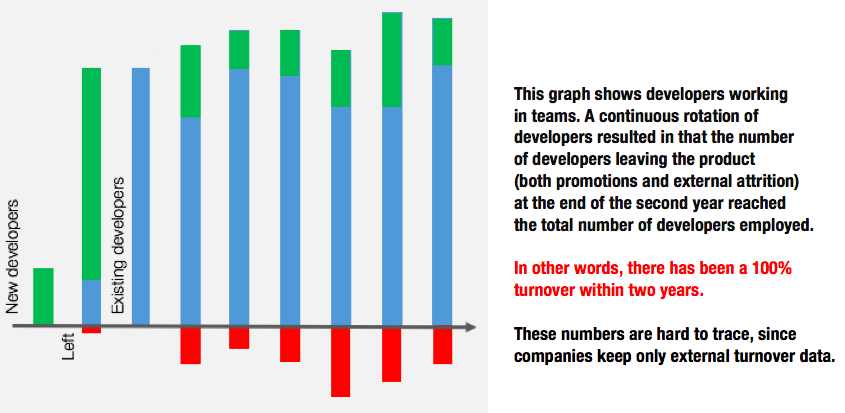
We have found that performance did not improve primarily because of attrition. Similarly to DutchCo, we have found that in order to employ 50+ developers, SwedCo have recruited the double amount of developers and lost half of them for various reasons, including internal promotions.

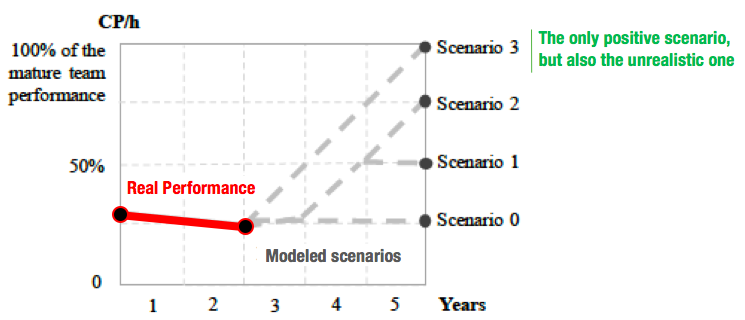
Finally, we have modeled a number of development scenarios for the performance and the costs, however the most positive hypothetical scenario, in which SwedCo could break even, is very unrealistic.

In just a few weeks I will revisit DutchCo and calculate their bottom-line costs using the performance data. They have implemented a number of improvements. Let’s see how it looks now. A post regarding the DutchCo case will be published. Meanwhile, if you would like me to calculate the bottom-line costs in your offshoring collaborations, contact me via darja.smite AT bth.se